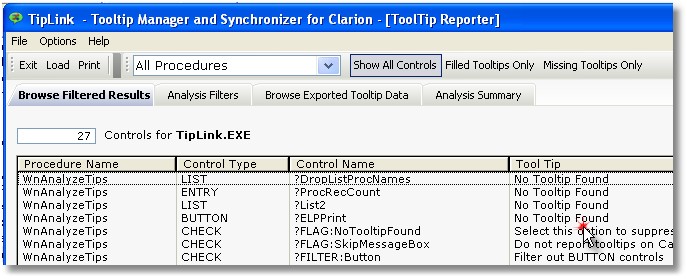
This is what it looks like:
HINT: You can click the headers to sort by column. This makes it easy to locate similar controls that might have different tooltips on them (such as all your OK or CANCEL buttons - "Thanks Steve!")
The listbox has these details:
The number of controls (this varies with filters and view) and the application name.
Procedure Name - the name of the procedure where the tooltips are located
Control Type - the type of control
Control Name - the USE variable name of the control
Tool Tip - the actual tooltip (depending on your settings you may also see No Tooltip Found)
Note: There is an option on the Analysis Filters tab to suppress this No Tooltip Found message. Selecting this option will leave a blank space on the printed report so you can use it as a worksheet to organize your tooltips.
You can change the view of the analysis with the three buttons on the toolbar:
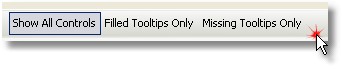
Show All Controls - this is the default value and it displays both filled and missing tooltips for all candidate controls
Filled Tooltips Only - displays only filled tooltips of candidate controls
Missing Tooltips Only - displays only missing tooltips of candidate controls
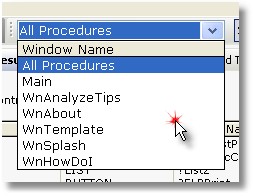
By default, All Procedures are shown (as indicated in the drop listbox). You can use the listbox to select any single procedure from your application and the view will be refreshed automatically.